Projects

The National Talent Mines
A Tableau dashboard I made that visualizes the high school locations of Rivals.com top 100 football recruits between 2005 and 2017. I used the site's source code to pull the top 100 profiles into a text document. I parsed this text document, geocoded the results, and created the dashboard using Tableau.

Housing Affordability in Santa Clara County
A map that shows the relationship between median list price and median government employee wage in Santa Clara County. Data for this map was sourced from Transparent California and Zillow.
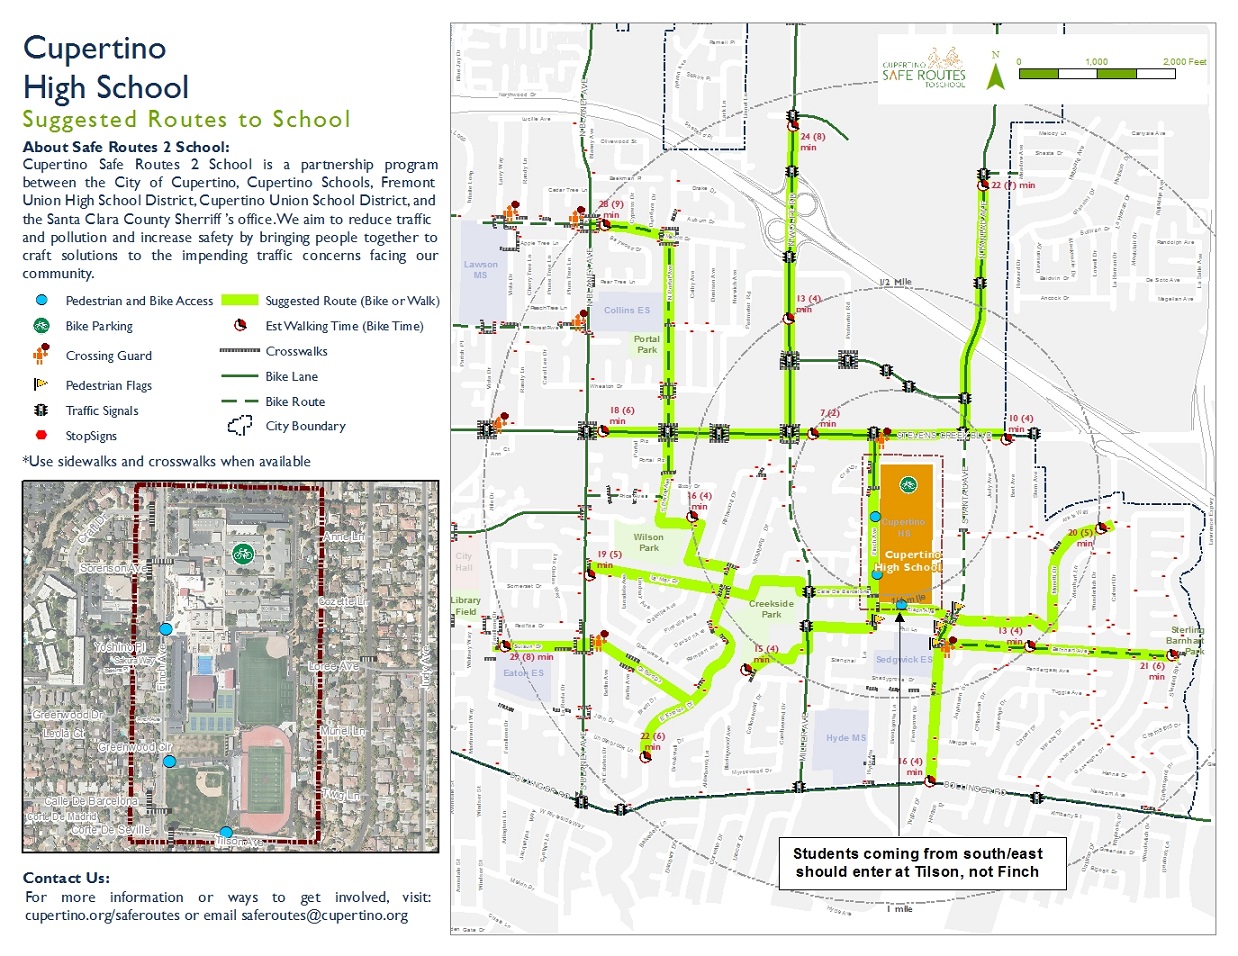
Cupertino Suggested Routes to School
One map from a series of maps highlighting safe bicycle and pedestrian routes to school. I was responsible for mapping the attendance areas and the design of the map and supporting text.
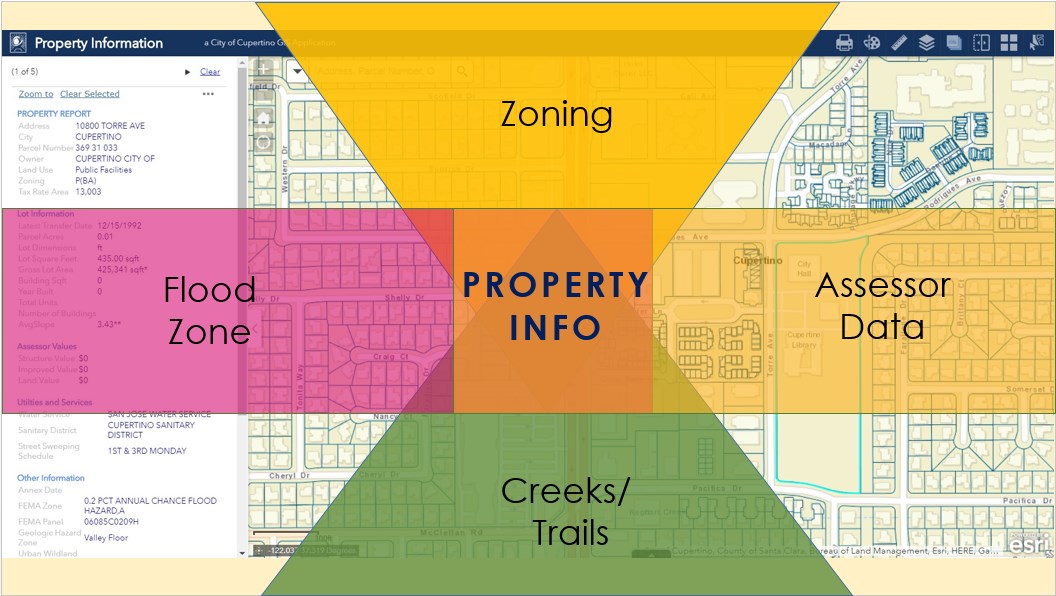
Cupertino Property Information
A web map application showing various property data for parcels in Cupertino. I wrote a Python script to combine over 20 datasets into one layer and utilized Esri's Web Appbuilder to create an online application for the public.
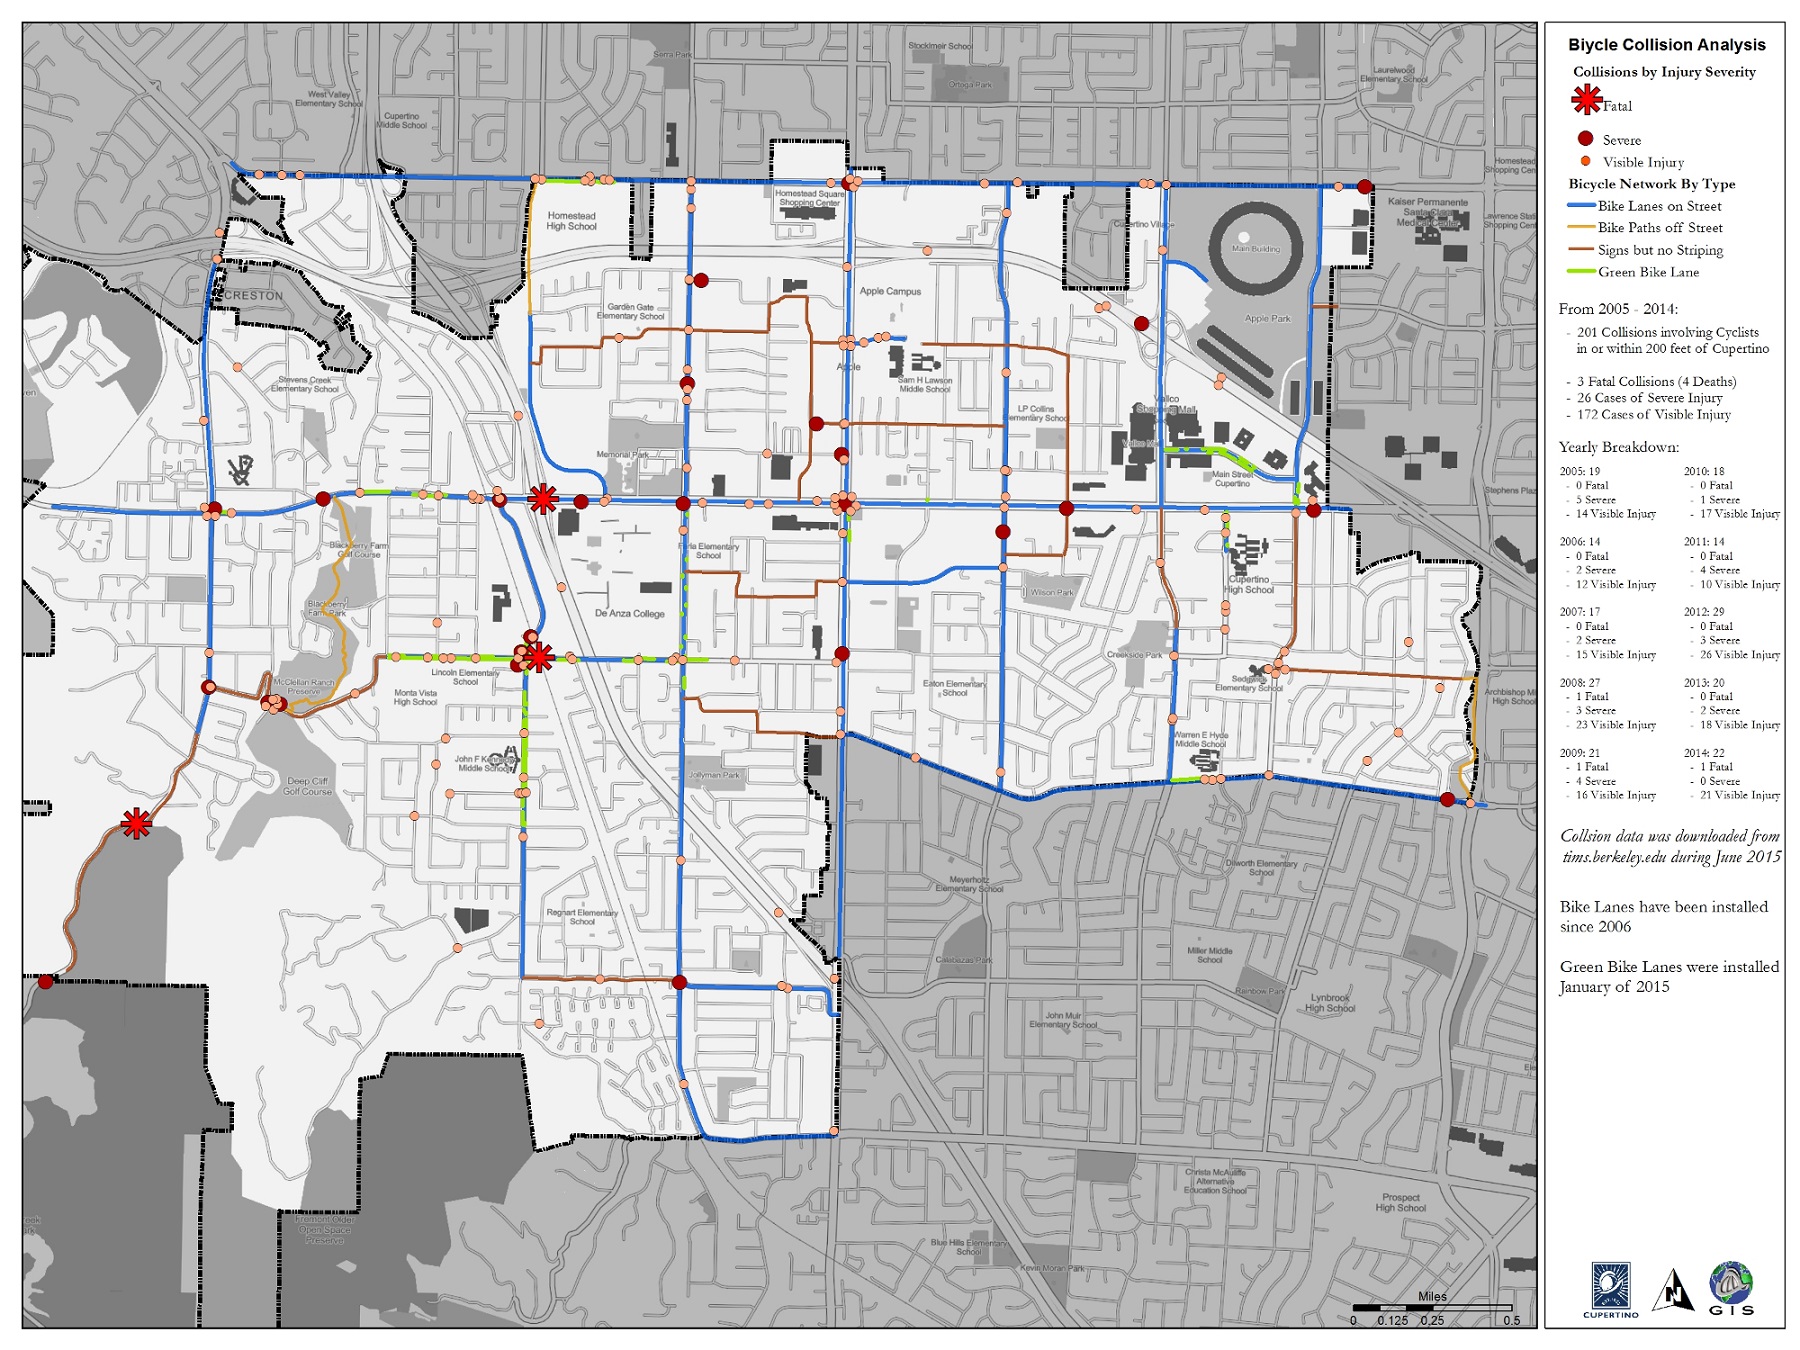
Cupertino Bicycle Collision Incidents
An incident map showing locations of bicycle collisions in Cupertino. I used data from TIMS to create the map and a time-lapse video. The map and video were displayed during a Bicycle Pedestrian Commission meeting.
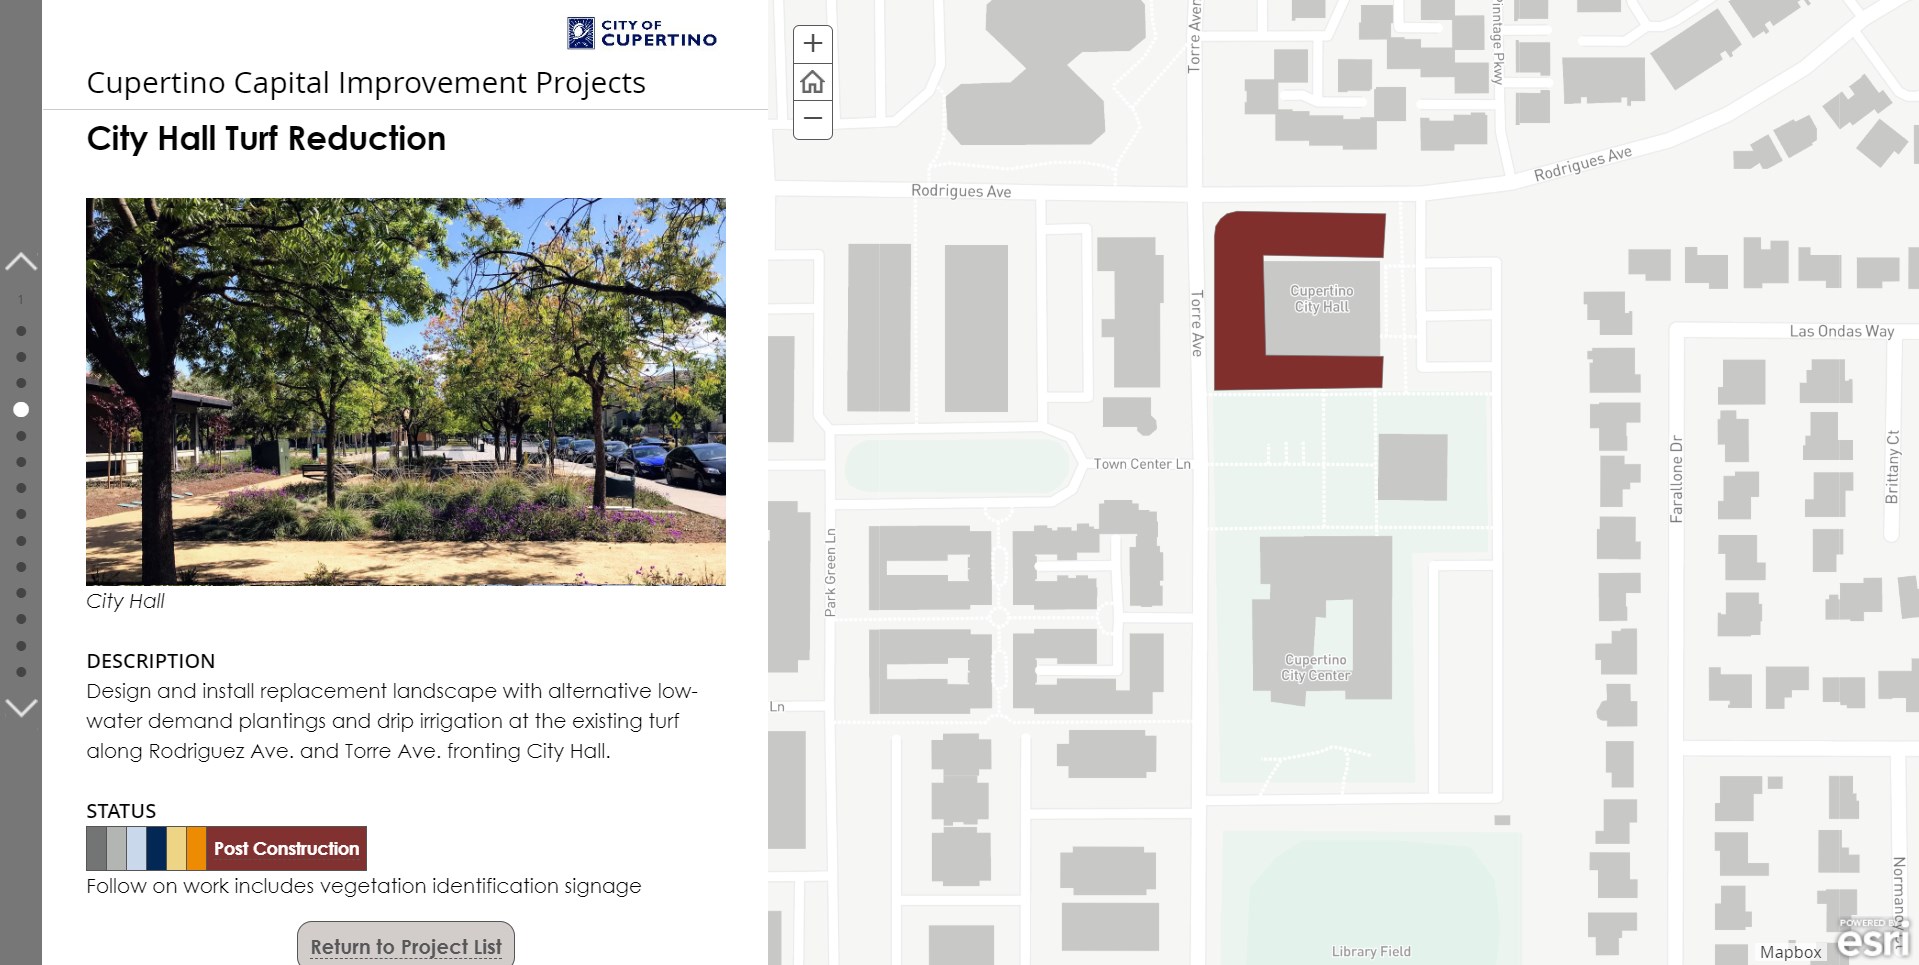
Cupertino Capital Improvement Projects
A web map application showing major Capital Improvement Projects in the City of Cupertino. I worked with our staff to get status updates, descriptions, locations and photos for each of the projects. I then drew polygons and lines in our GIS, uploaded them, and created an Esri Story Map. (In progress)
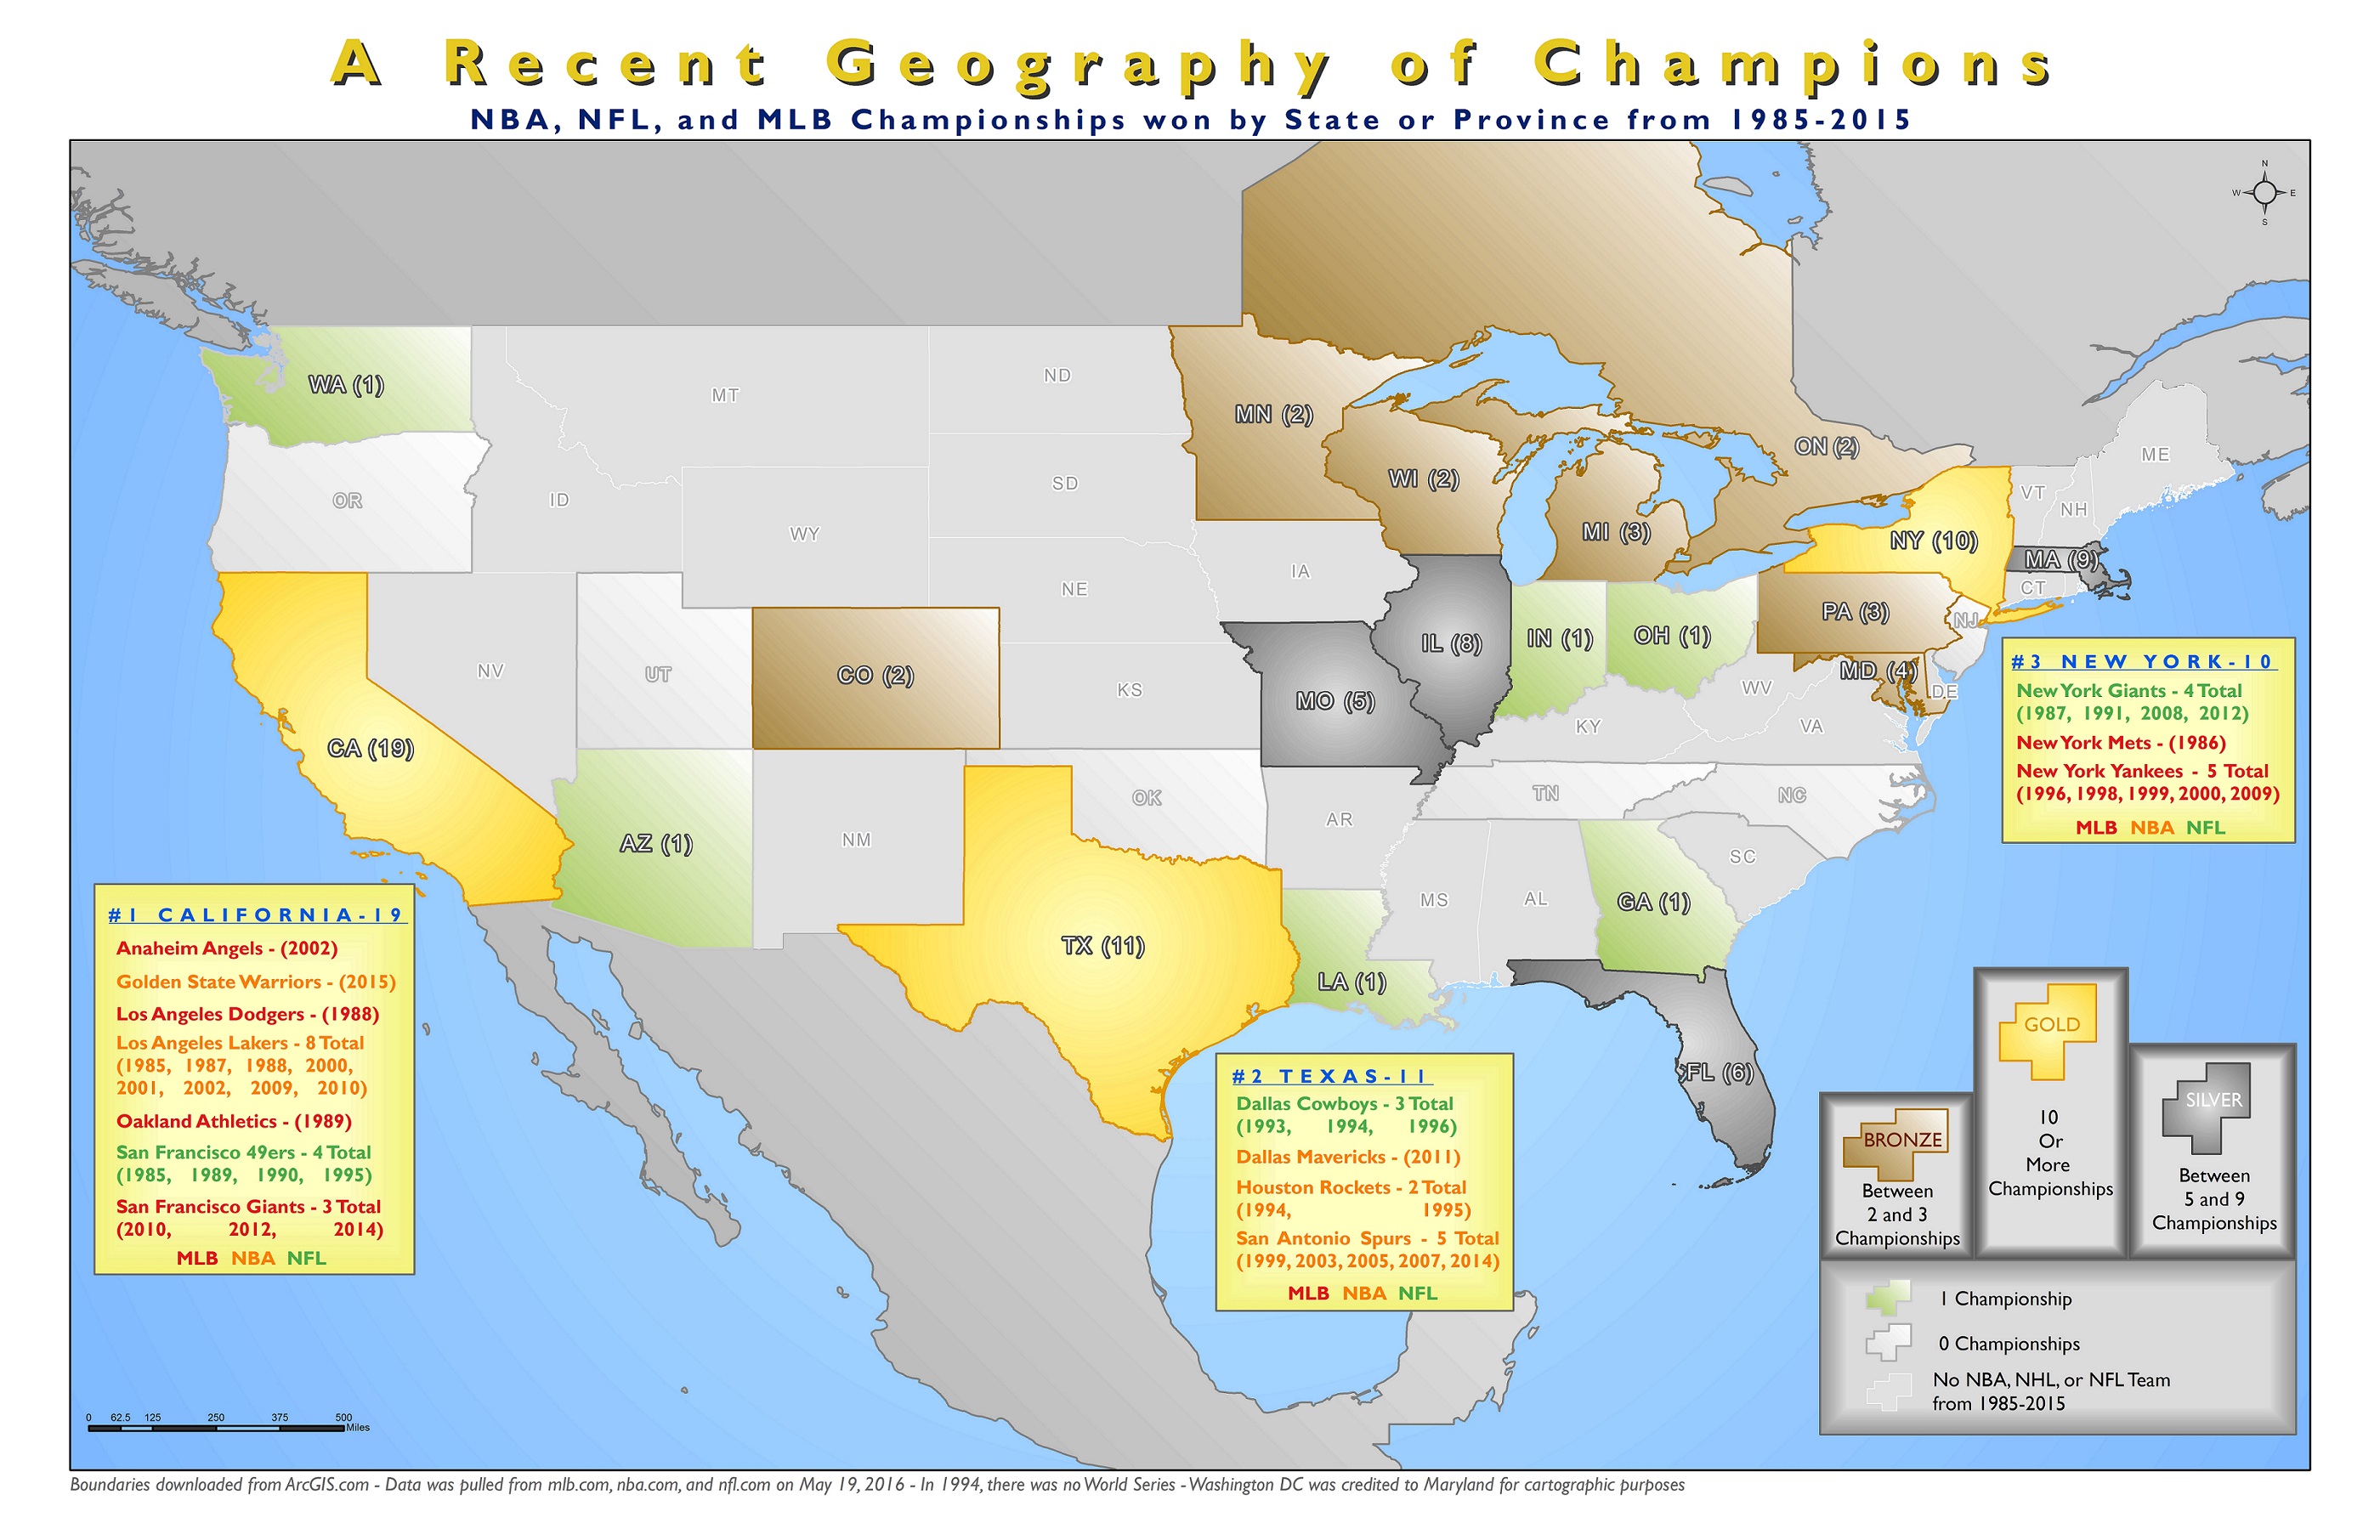
The Geography of Champions
A fun map I made visualizing the states that were home to a championship MLB, NBA, or NFL between 1985 and 2015. I pulled the data from Wikipedia and imported it into an Excel file and created a map.